Why You Need Google Analytics for Your Canva Website
Tracking website analytics is crucial for businesses and individuals alike, as it provides valuable insights into user behavior, helping to improve the overall user experience and inform data-driven decisions. By understanding how visitors interact with your Canva website, you can identify areas for improvement, optimize your content and design, and ultimately drive more conversions and sales. Google Analytics is a powerful tool that can help you achieve these goals, and in this article, we will explore how to embed Google Analytics in a Canva website.
With Google Analytics, you can track key metrics such as page views, bounce rates, and average session duration, giving you a deeper understanding of your website’s performance. You can also set up goals and events to track specific user interactions, such as form submissions or button clicks, and use this data to refine your marketing strategy and improve your website’s overall effectiveness.
Moreover, Google Analytics provides a range of features that can help you gain a better understanding of your target audience, including demographic and interest-based data. By analyzing this data, you can create more targeted and effective marketing campaigns, and tailor your content and design to meet the needs and preferences of your ideal customer.
While Canva websites offer a range of built-in analytics tools, Google Analytics provides a more comprehensive and detailed picture of your website’s performance. By integrating Google Analytics with your Canva website, you can gain a deeper understanding of your users’ behavior and preferences, and use this data to drive more conversions and sales.
In the following sections, we will explore the process of embedding Google Analytics in a Canva website, including creating a Google Analytics account, setting up a property, and configuring goals and events. We will also discuss common issues that may arise during the integration process, and provide tips and best practices for getting the most out of Google Analytics.
Getting Started with Google Analytics: Creating an Account and Setting Up a Property
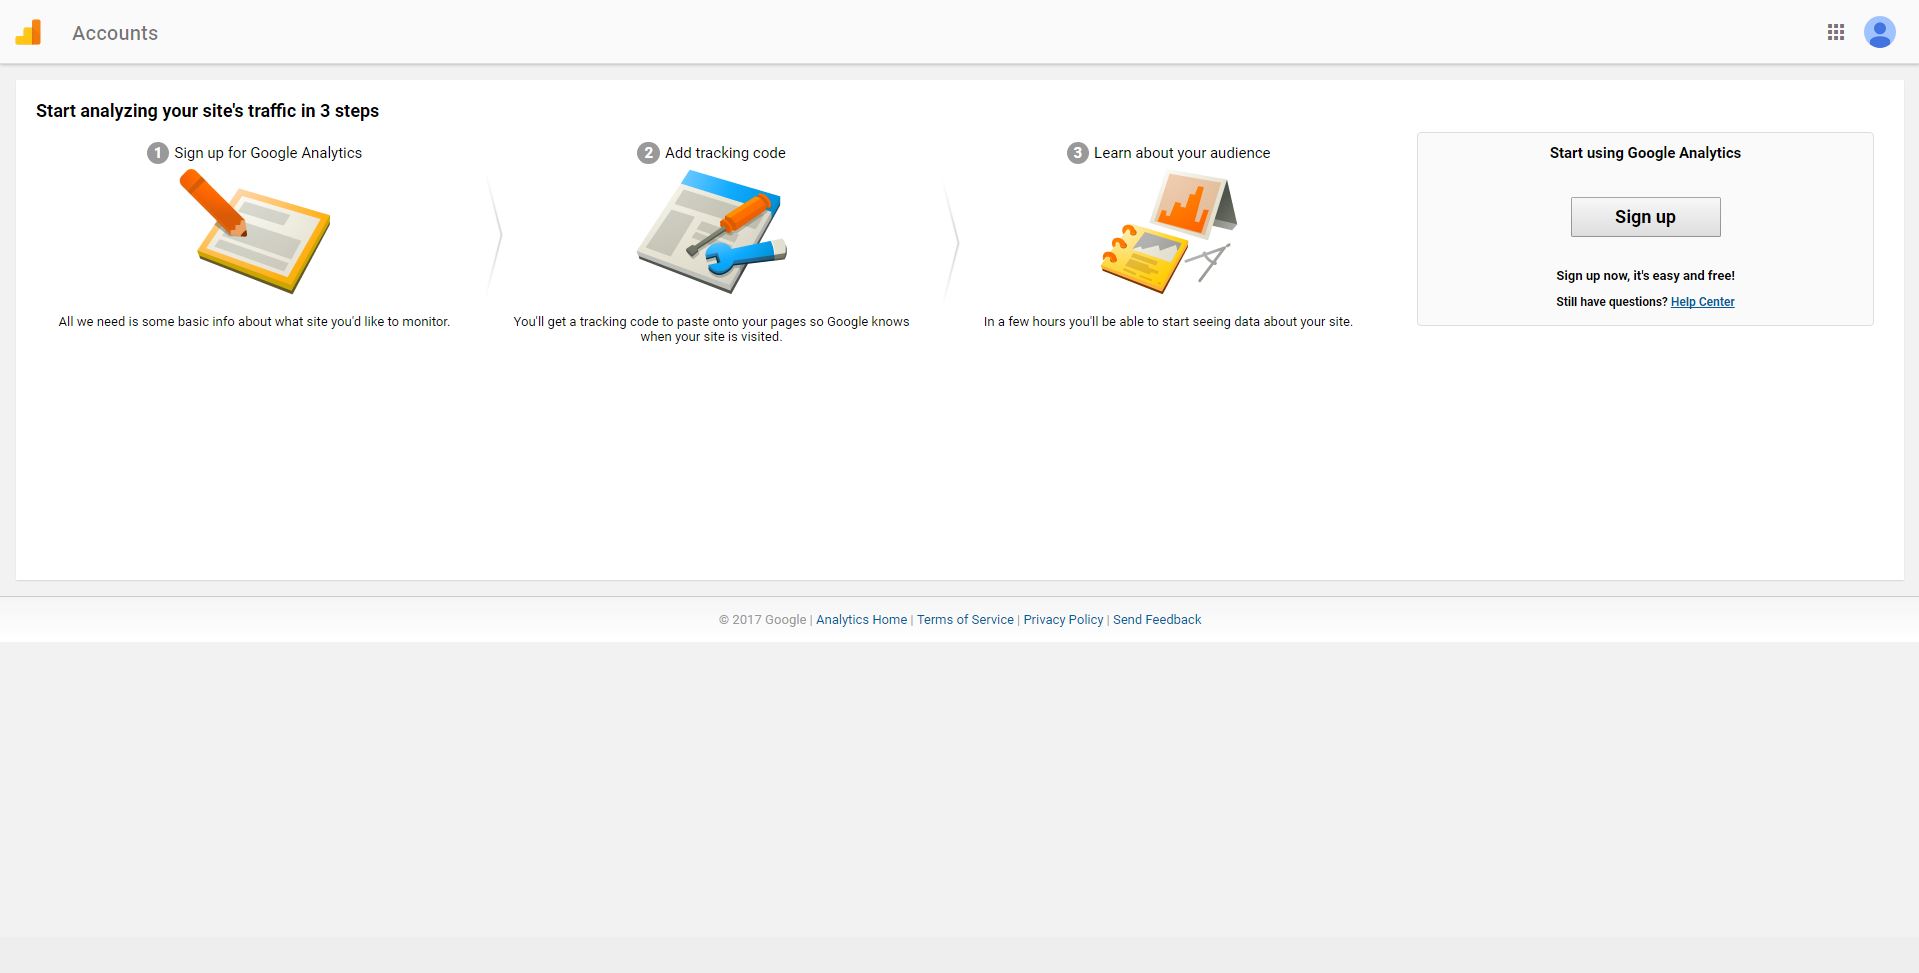
To get started with Google Analytics, you’ll need to create an account and set up a property. A property in Google Analytics refers to a website, app, or other digital platform that you want to track. To create a Google Analytics account, go to the Google Analytics website and sign in with your Google account. If you don’t have a Google account, you can create one for free.
Once you’re signed in, click on the “Create” button to start setting up your account. You’ll be asked to provide some basic information about your website, such as its name, URL, and industry category. You’ll also need to choose a reporting time zone and currency.
Next, you’ll need to set up a property in Google Analytics. A property is a container for your website’s data, and it’s where you’ll configure your tracking settings. To set up a property, click on the “Create Property” button and follow the prompts. You’ll need to provide some basic information about your website, such as its name and URL.
Google Analytics offers two types of tracking codes: gtag.js and analytics.js. The gtag.js code is the newer and more recommended option, as it provides more advanced features and better performance. To get your tracking code, click on the “Get Tracking ID” button and follow the prompts. You’ll need to copy and paste the code into your website’s HTML header or footer.
It’s also important to note that Google Analytics has a data retention policy, which means that it will automatically delete your data after a certain period of time. You can adjust this setting in your account settings, but it’s generally recommended to keep your data for at least 26 months.
Now that you have your Google Analytics account set up and your tracking code installed, you’re ready to start tracking your website’s data. In the next section, we’ll discuss the basics of Canva websites and how they differ from traditional websites, which will help you understand how to integrate Google Analytics with your Canva website.
Canva Website Basics: Understanding the Platform’s Limitations and Capabilities
Canva is a popular website builder that allows users to create professional-looking websites without needing to know how to code. Canva websites are known for their ease of use, flexibility, and affordability. However, they also have some limitations and capabilities that are important to understand when it comes to integrating Google Analytics.
One of the main limitations of Canva websites is that they are built on a proprietary platform, which can make it difficult to customize and extend their functionality. This can make it challenging to integrate third-party tools and services, including Google Analytics. However, Canva has made significant improvements in recent years to make it easier to integrate Google Analytics and other third-party tools.
Another limitation of Canva websites is that they are not as flexible as traditional websites when it comes to design and layout. Canva websites are built using a drag-and-drop editor, which can make it difficult to create complex or custom designs. However, this also makes it easier to create a website quickly and easily, without needing to know how to code.
Despite these limitations, Canva websites have many capabilities that make them well-suited for integrating Google Analytics. For example, Canva websites are highly customizable, which makes it easy to add Google Analytics tracking codes and other third-party tools. Additionally, Canva websites are highly scalable, which means that they can handle large amounts of traffic and data.
When it comes to integrating Google Analytics with a Canva website, it’s also important to understand the different types of Canva websites that are available. Canva offers a range of website templates and designs, each with its own unique features and capabilities. Some Canva websites are designed specifically for e-commerce, while others are designed for blogging or portfolio websites.
Understanding the basics of Canva websites and their limitations and capabilities is essential for integrating Google Analytics successfully. In the next section, we’ll provide a step-by-step guide on how to embed Google Analytics in a Canva website, including copying and pasting the tracking code, using Canva’s built-in Google Analytics integration, and verifying the setup.
Embedding Google Analytics in Your Canva Website: A Step-by-Step Guide
Now that you have a Google Analytics account set up and a property created, it’s time to embed the tracking code in your Canva website. This will allow you to start collecting data and tracking user behavior on your website. In this section, we’ll provide a step-by-step guide on how to embed Google Analytics in a Canva website.
Step 1: Copy the Tracking Code
Log in to your Google Analytics account and navigate to the Admin section. Click on the “Tracking Info” tab and then click on the “Tracking Code” button. Copy the tracking code that appears in the pop-up window.
Step 2: Paste the Tracking Code in Canva
Log in to your Canva account and navigate to the website editor. Click on the “Settings” icon (represented by a gear) and then click on the “Advanced” tab. Scroll down to the “Custom Code” section and click on the “Add Custom Code” button. Paste the tracking code you copied in Step 1 into the “Head” section.
Step 3: Verify the Setup
Once you’ve pasted the tracking code, click on the “Save” button to save the changes. Then, navigate to the Google Analytics dashboard and click on the “Real-Time” tab. If everything is set up correctly, you should see data starting to flow in within a few minutes.
Using Canva’s Built-in Google Analytics Integration
Canva also offers a built-in Google Analytics integration that makes it easy to connect your Google Analytics account to your Canva website. To use this integration, navigate to the Canva website editor and click on the “Settings” icon (represented by a gear). Then, click on the “Advanced” tab and scroll down to the “Google Analytics” section. Click on the “Connect” button and follow the prompts to connect your Google Analytics account.
Verifying the Setup
Once you’ve connected your Google Analytics account using Canva’s built-in integration, verify that the setup is working correctly by navigating to the Google Analytics dashboard and clicking on the “Real-Time” tab. If everything is set up correctly, you should see data starting to flow in within a few minutes.
Configuring Google Analytics for Your Canva Website: Goals, Events, and E-commerce Tracking
Once Google Analytics is embedded in a Canva website, it’s essential to configure it to track specific user interactions and conversions. This involves setting up goals, events, and e-commerce tracking, which provide valuable insights into user behavior and help businesses make data-driven decisions.
To set up goals in Google Analytics, navigate to the Admin section, click on Goals, and then click on the New Goal button. Choose a goal template or create a custom goal, and then define the goal details, such as the goal name, type, and funnel. For example, a goal for a Canva website might be to track the number of users who complete a contact form or make a purchase.
Events in Google Analytics allow businesses to track specific user interactions, such as button clicks, video plays, or file downloads. To set up events, navigate to the Admin section, click on Events, and then click on the New Event button. Define the event category, action, and label, and then specify the event trigger, such as a button click or page load.
E-commerce tracking in Google Analytics provides insights into online sales and revenue. To set up e-commerce tracking, navigate to the Admin section, click on E-commerce Settings, and then click on the Enable E-commerce button. Define the e-commerce settings, such as the currency and tax rates, and then specify the e-commerce data, such as the product name, price, and quantity.
For Canva websites, it’s essential to track specific user interactions, such as form submissions, button clicks, or page views. To track these interactions, use the Google Analytics event tracking code, which can be added to the Canva website’s HTML code. For example, to track a button click, add the following code to the button’s HTML code: onClick="ga('send', 'event', 'button', 'click', 'Button Name');"
By configuring Google Analytics to track goals, events, and e-commerce data, businesses can gain valuable insights into user behavior and make data-driven decisions to improve their Canva website’s performance. Remember to regularly review and analyze the Google Analytics data to identify areas for improvement and optimize the website for better user experience and conversion rates.
Troubleshooting Common Issues with Google Analytics on Canva Websites
When integrating Google Analytics with a Canva website, several issues may arise, including tracking code errors, data discrepancies, and setup problems. In this section, we’ll discuss common issues and provide troubleshooting tips to help resolve them.
One common issue is the tracking code not being installed correctly. To resolve this, ensure that the tracking code is copied and pasted correctly into the Canva website’s HTML code. Check that the code is placed in the correct location, usually in the header or footer section. If using Canva’s built-in Google Analytics integration, ensure that the integration is enabled and the tracking ID is entered correctly.
Data discrepancies are another common issue. This can occur when the data in Google Analytics doesn’t match the data in Canva’s analytics. To resolve this, check that the tracking code is installed correctly and that the data is being sent to the correct Google Analytics property. Also, ensure that the date range and filters are set correctly in Google Analytics.
Setup problems can also occur when integrating Google Analytics with Canva. To resolve this, ensure that the Google Analytics account is set up correctly and that the property is created. Also, ensure that the tracking code is installed correctly and that the data is being sent to the correct Google Analytics property.
Other common issues include:
- Tracking code not firing: Check that the tracking code is installed correctly and that the data is being sent to the correct Google Analytics property.
- Data not being tracked: Check that the tracking code is installed correctly and that the data is being sent to the correct Google Analytics property.
- Goals not being tracked: Check that the goals are set up correctly in Google Analytics and that the tracking code is installed correctly.
To troubleshoot these issues, use the Google Analytics Debugger Chrome extension, which allows you to debug and troubleshoot Google Analytics tracking code issues. Also, use the Google Analytics Real-Time reports to see if the data is being sent to Google Analytics in real-time.
By following these troubleshooting tips, you can resolve common issues that may arise when integrating Google Analytics with a Canva website. Remember to regularly check the Google Analytics data to ensure that it is accurate and reliable.
Maximizing Your Canva Website’s Potential with Google Analytics Insights
Now that Google Analytics is integrated with your Canva website, it’s time to unlock the full potential of your website by analyzing user behavior, identifying areas for improvement, and making data-driven design decisions.
Google Analytics provides a wealth of information about your website’s performance, including page views, bounce rates, and conversion rates. By analyzing this data, you can identify areas of your website that need improvement and make data-driven decisions to optimize your website’s performance.
One of the most important metrics to track is user behavior. Google Analytics provides insights into how users interact with your website, including which pages they visit, how long they stay, and what actions they take. By analyzing this data, you can identify patterns and trends that can help you optimize your website’s user experience.
For example, if you notice that users are bouncing from your homepage at a high rate, you may want to consider revising your homepage content or design to better engage users. Similarly, if you notice that users are spending a lot of time on a particular page, you may want to consider adding more content or features to that page to keep users engaged.
Google Analytics also provides insights into conversion rates, which can help you optimize your website’s conversion funnel. By tracking conversions, you can identify which pages and elements of your website are driving the most conversions and optimize those elements to improve conversion rates.
In addition to analyzing user behavior and conversion rates, Google Analytics also provides insights into your website’s technical performance. By tracking metrics such as page load time and browser usage, you can identify technical issues that may be impacting your website’s performance and make data-driven decisions to optimize your website’s technical performance.
To get the most out of Google Analytics insights, it’s essential to regularly review and analyze your website’s data. Set up regular reporting and analysis to track your website’s performance over time and identify areas for improvement.
Some additional tips for maximizing your Canva website’s potential with Google Analytics insights include:
- Use Google Analytics segments to track specific user groups and behaviors.
- Set up Google Analytics goals to track conversions and other important events.
- Use Google Analytics A/B testing to test different design and content variations.
- Integrate Google Analytics with other tools and platforms, such as Google Ads and social media, to get a more complete picture of your website’s performance.
By following these tips and regularly reviewing and analyzing your Google Analytics data, you can unlock the full potential of your Canva website and drive more traffic, engagement, and conversions.
Conclusion: Unlocking the Full Potential of Your Canva Website with Google Analytics
Integrating Google Analytics with a Canva website is a powerful way to unlock valuable insights into user behavior, improve user experience, and make data-driven decisions. By following the steps outlined in this guide, you can easily embed Google Analytics in your Canva website and start tracking key metrics and events.
Remember, the key to getting the most out of Google Analytics is to regularly review and analyze your website’s data. By doing so, you can identify areas for improvement, optimize your website’s performance, and drive more traffic, engagement, and conversions.
Some final tips to keep in mind when using Google Analytics with your Canva website include:
- Regularly review your website’s data to identify trends and patterns.
- Use Google Analytics segments to track specific user groups and behaviors.
- Set up Google Analytics goals to track conversions and other important events.
- Use Google Analytics A/B testing to test different design and content variations.
By following these tips and using Google Analytics to its full potential, you can unlock the full potential of your Canva website and drive more success for your business or organization.
In conclusion, integrating Google Analytics with a Canva website is a straightforward process that can provide valuable insights into user behavior and help you make data-driven decisions. By following the steps outlined in this guide and regularly reviewing and analyzing your website’s data, you can unlock the full potential of your Canva website and drive more success for your business or organization.
So why wait? Start using Google Analytics with your Canva website today and discover the power of data-driven decision making for yourself.


